Data set: Chicken (Gallus gallus) nucleosomes reconstituted on a well-positioning 601 DNA sequence, DNA is radioactively labeled on 5’ end. Products of PCR with dideoxynucleotide triphosphates were run side-by-side the HRF gel lanes to assign HRF peaks to DNA sequence. Data set taken from Morozov et al., NAR 2009.
This is a generic example that outlines HRF data quantification from a gel image with 5’ labeled DNA. It illustrates algorithm robustness with respect to quantification of independent experiments, noise tolerance and special fitting features such as constraints on the peak width and acconting for the peaks outside of the studied data range.
Python files implementing every stage are provided in this directory.
The contents of this directory can be conveniently downloaded by the following command once HYDROID is installed:
HYDROID_get_ex2
Video tutorial outlining the key stages is available here.
python exp_s2_assign_peaks.py
python exp_s3_call_peaks.py
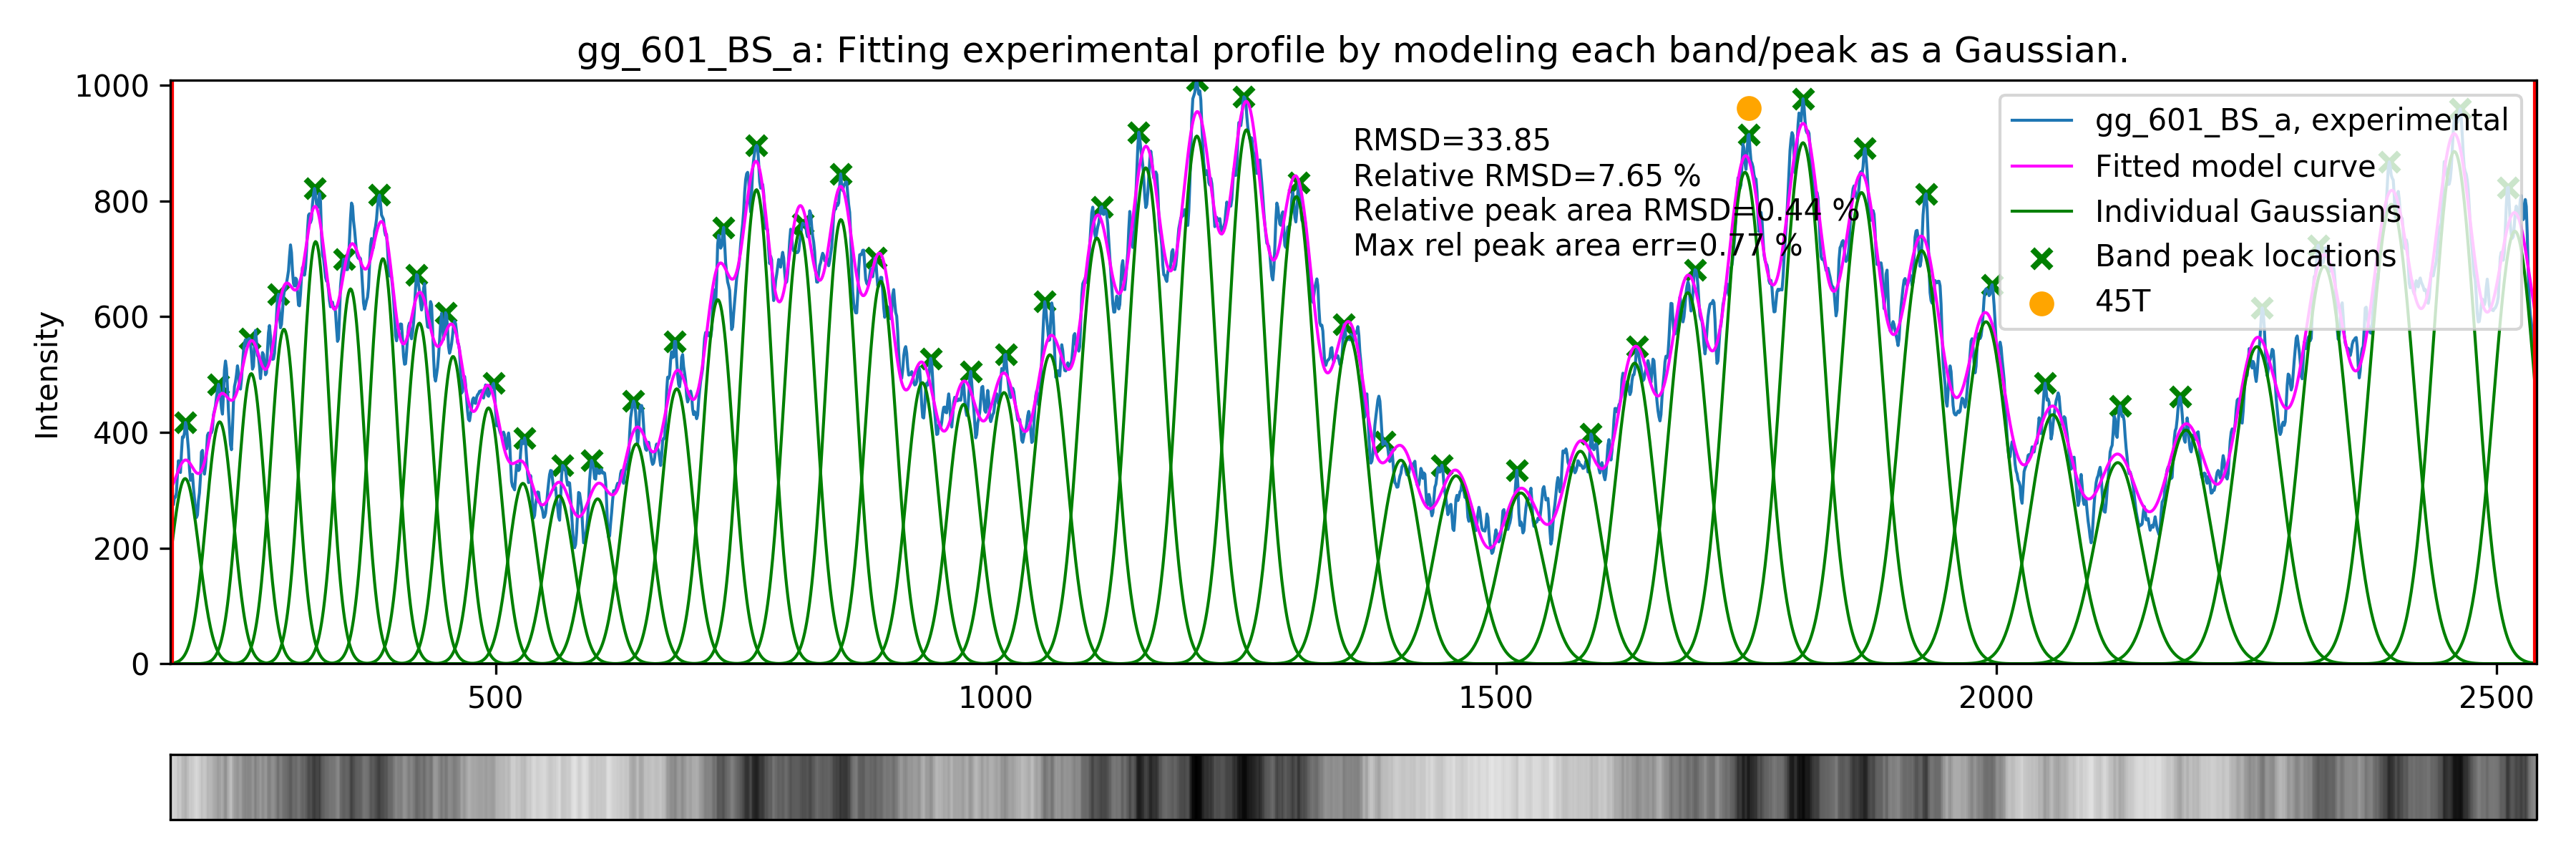
python exp_s4_fit_model.py
See fitting results.
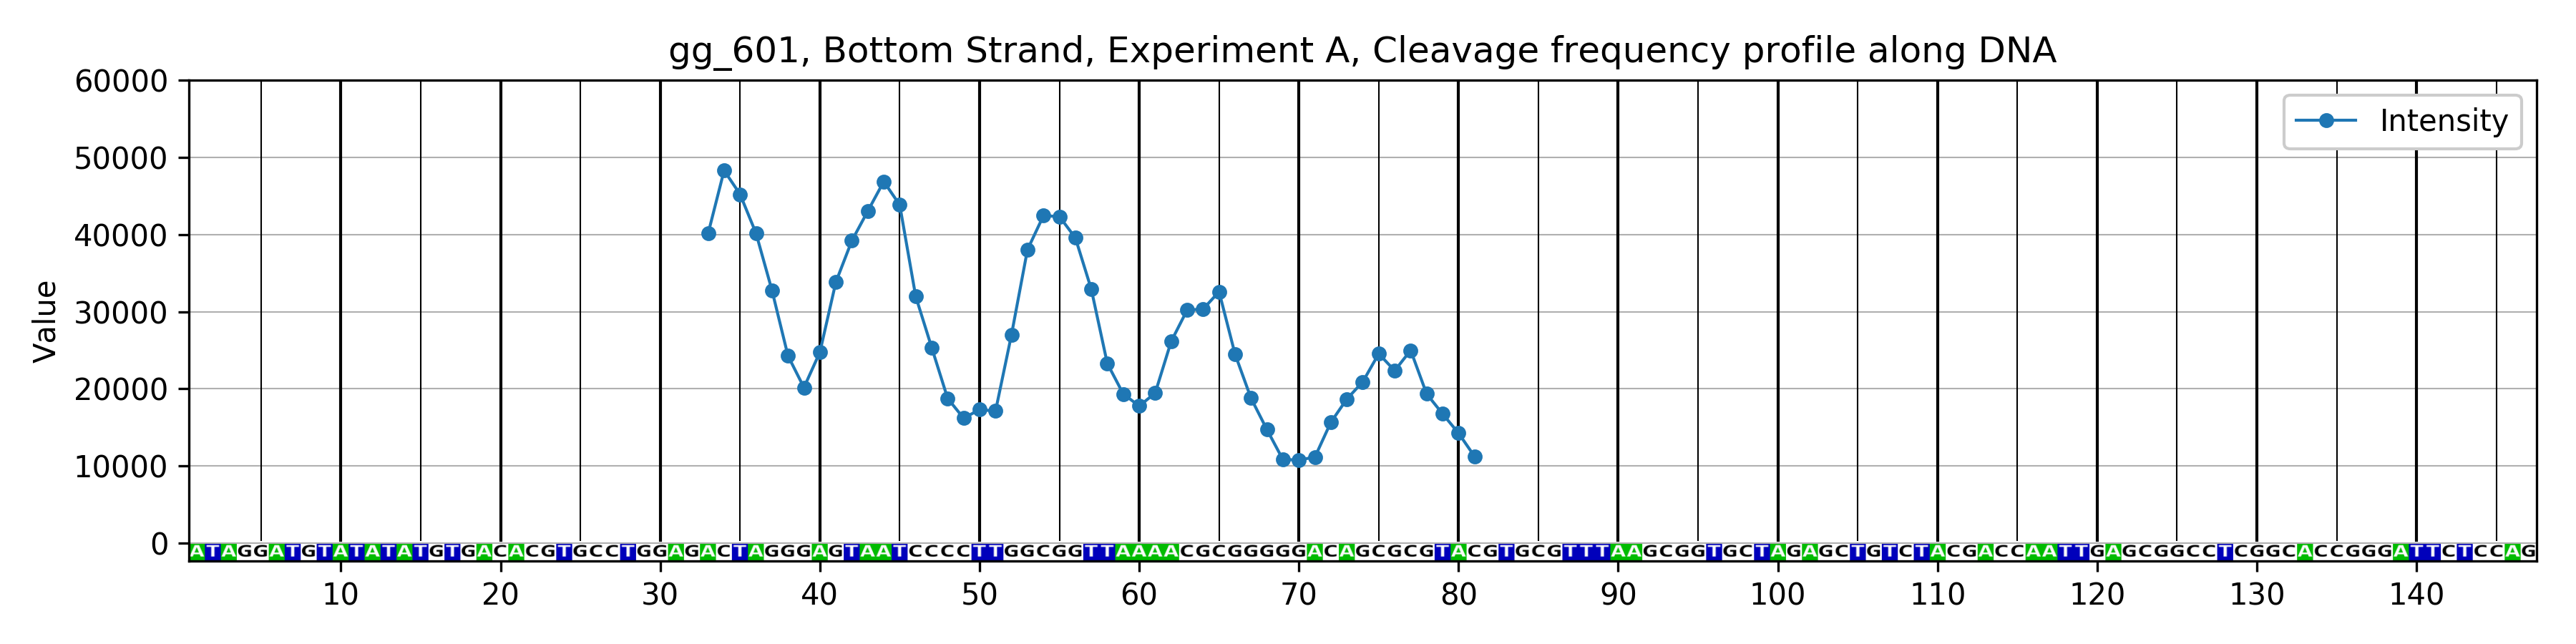
python exp_s5_plot_cl_freq.py
See the resulting plots.
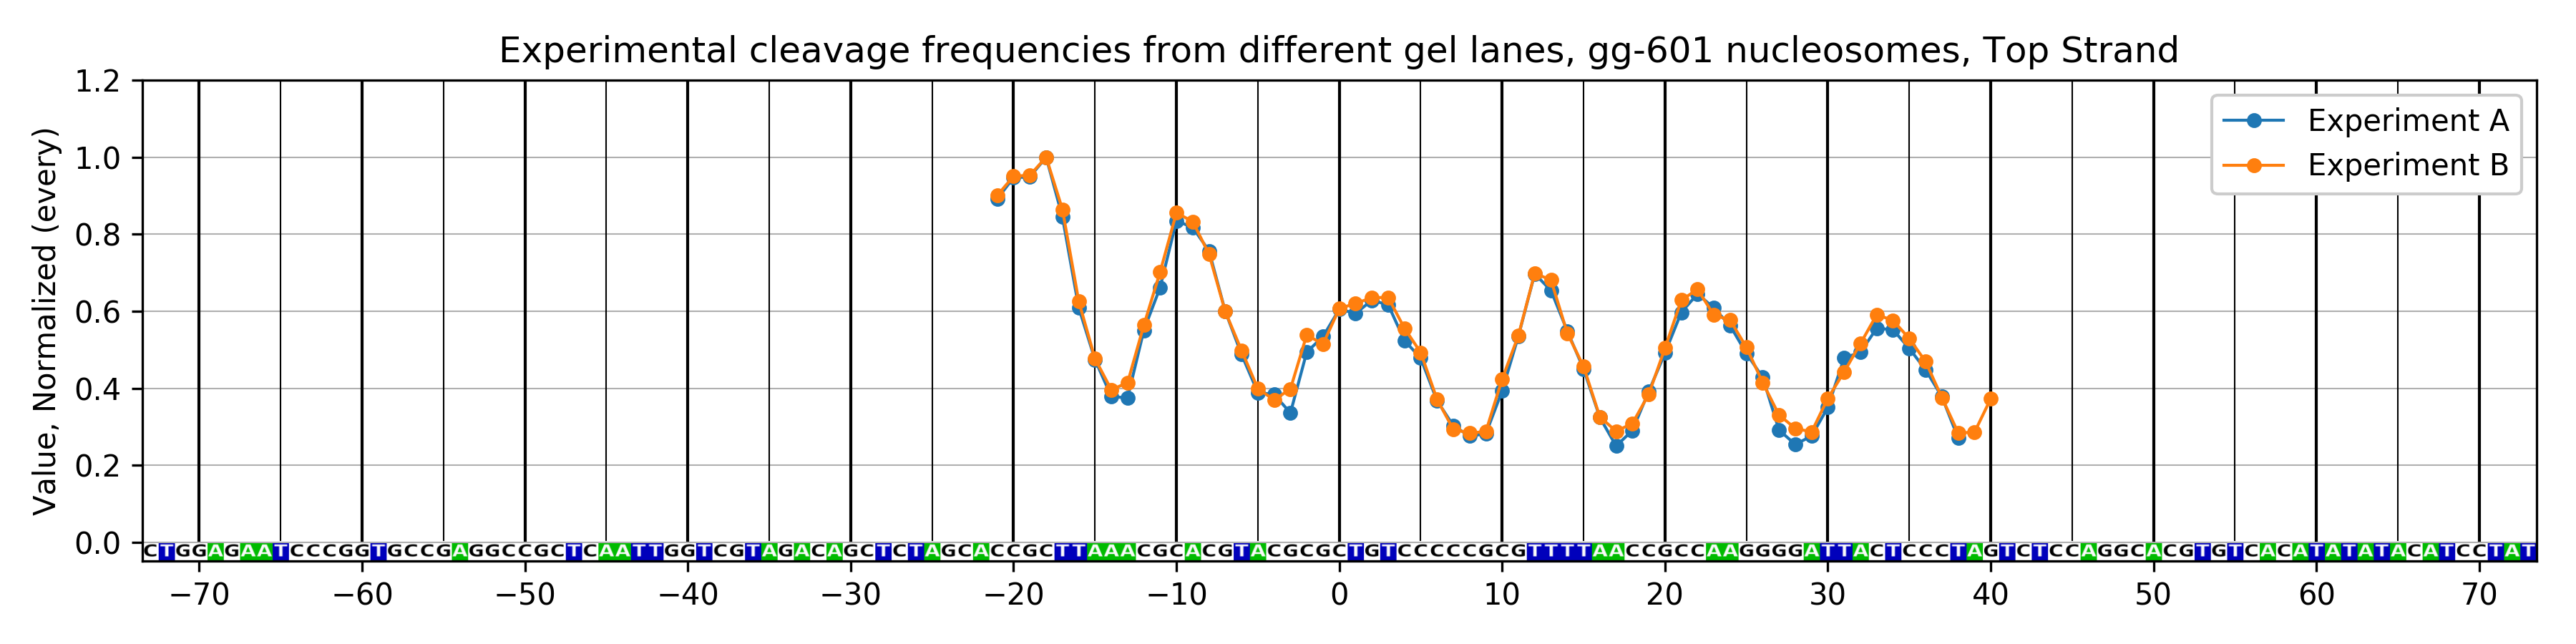
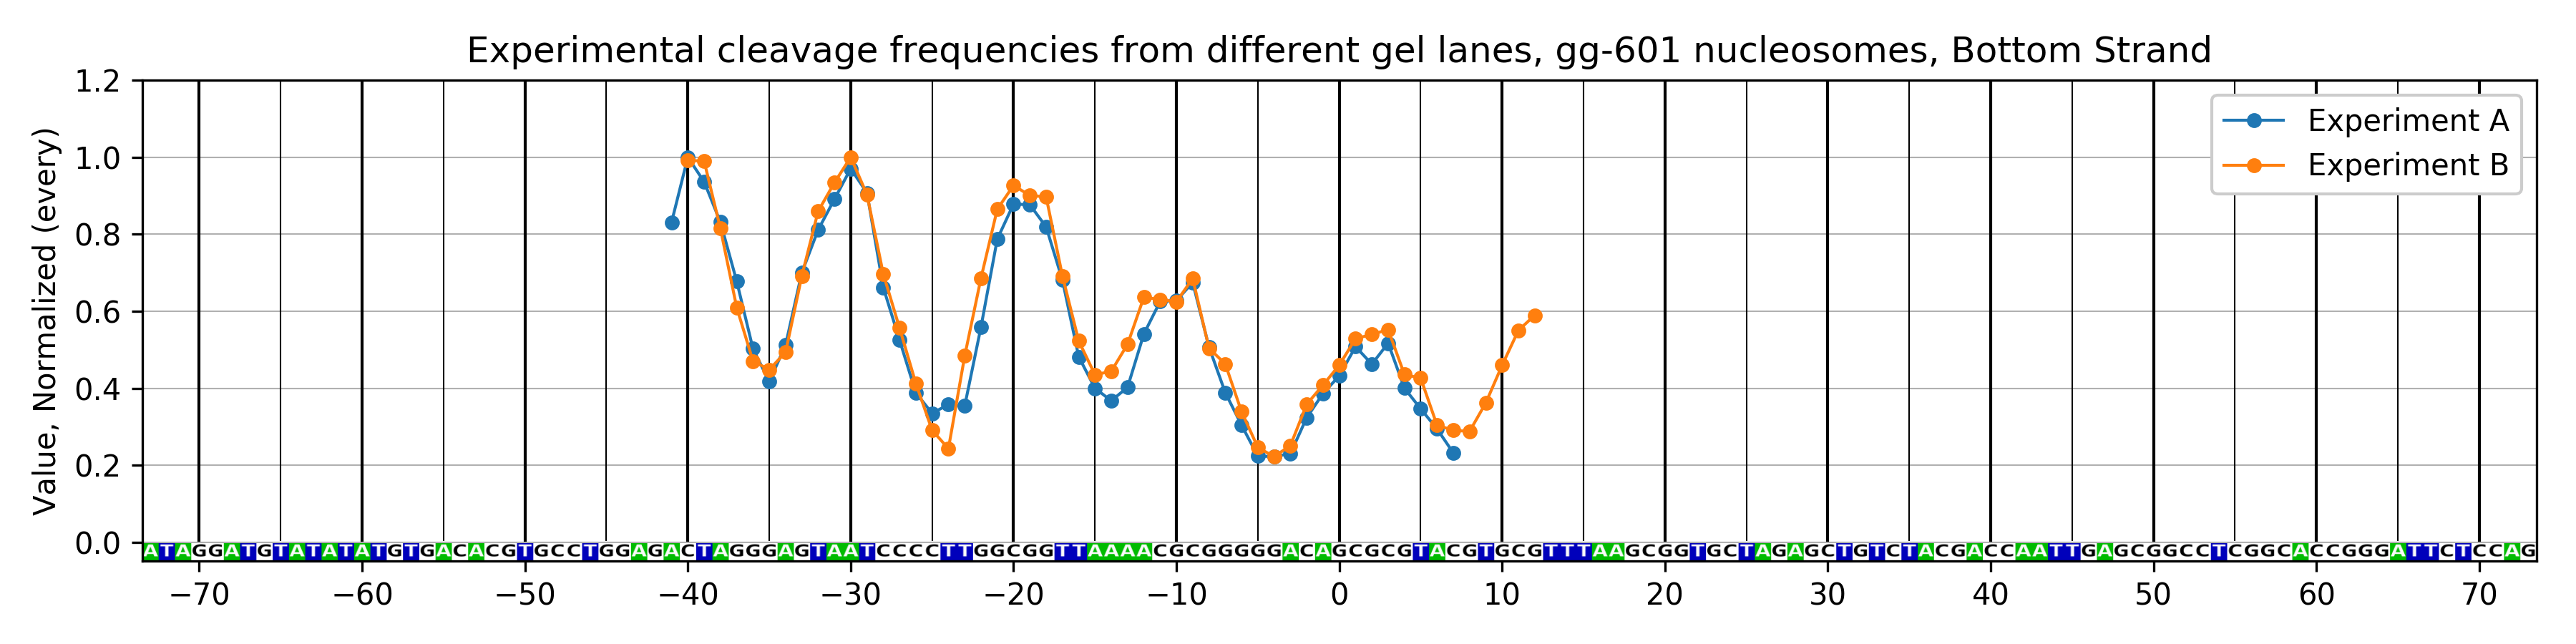
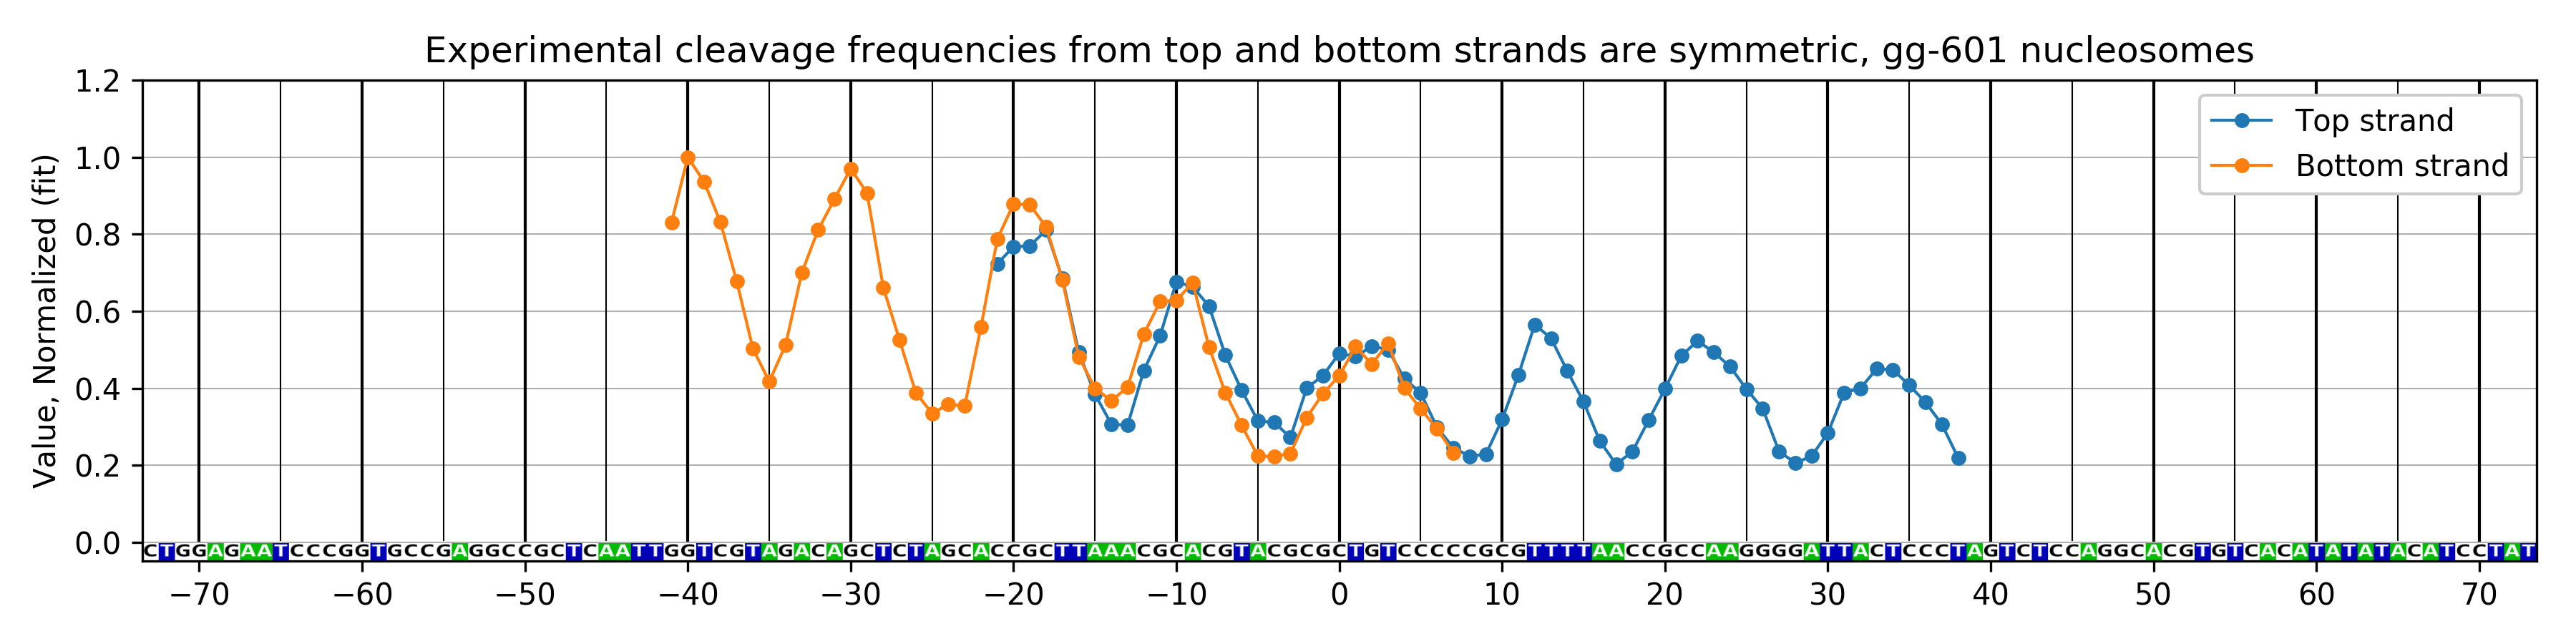
python compare_exp.py
Get comparative plots for top and bottom strands from different gel lanes. Get compartive plots between top and bottom DNA strands to assess pseudosymmetry of nucleosome with respect to the two-fold dyad symmetry axis.