System: S. cerevisiae centromeric nucleosome reconstituted on a well-positioning 601TA DNA sequence, DNA is radioactively labeled on 3’ end. Maxam-Gilbert sequencing reactions products were run side-by-side with the HRF gel lanes to assign HRF peaks to the sites on DNA sequence. Data set is taken from Shaytan et al., NAR (2017).
This is a generic example that outlines (1) HRF data quantification from a gel image with the 3’ labeled DNA, (2) prediction of theoretical profiles from PDB strucutres, (3) data comparison.
Python files implementing every stage are provided in this directory.
The contents of this directory can be conveniently downloaded by the following command once HYDROID is installed:
HYDROID_get_ex1
Document H-SASA_params.md further outlines details of theoretical cleavage profiles calculation and their dependence on various parameters.
Video tutorial outlining the key stages is available here.
python exp_s2_assign_peaks.py
python exp_s3_call_peaks.py
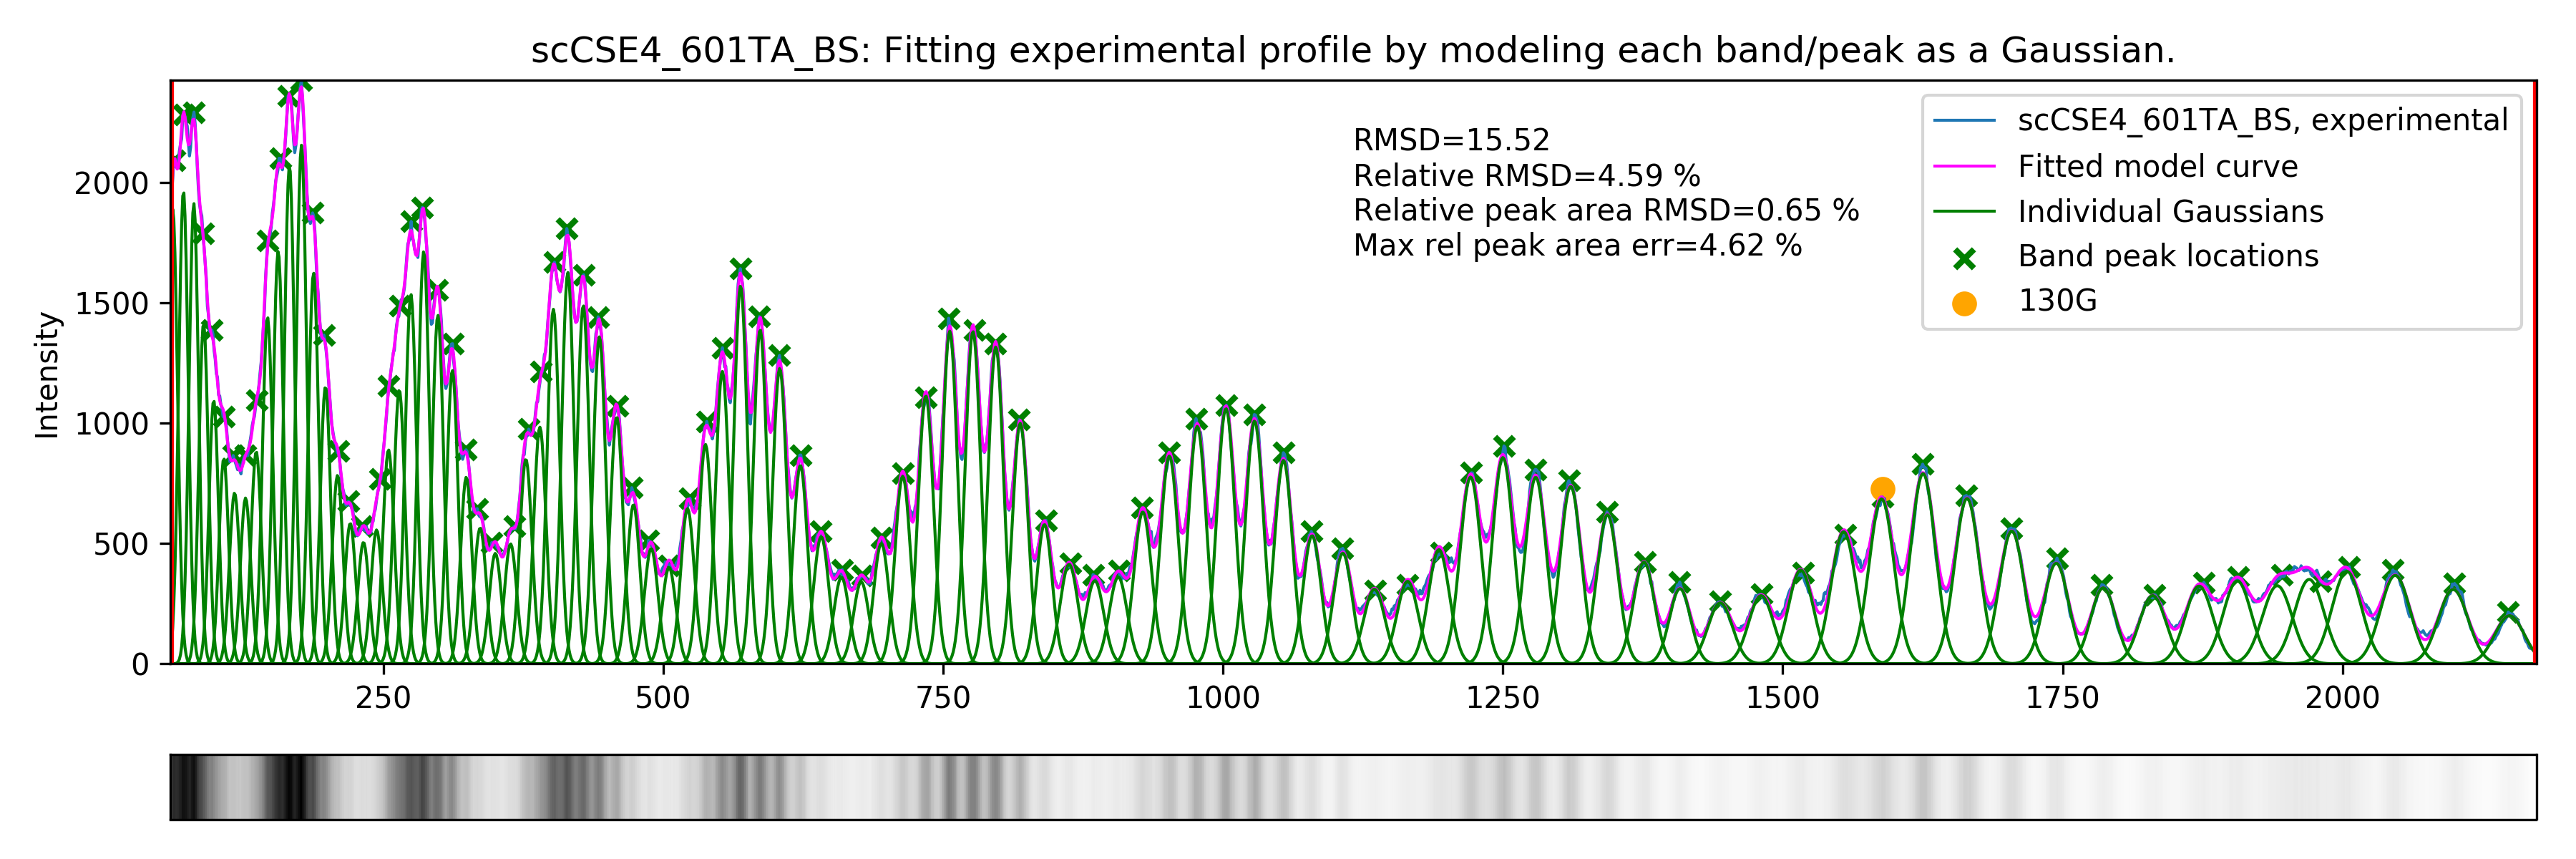
python exp_s4_fit_model.py
See fitting results.
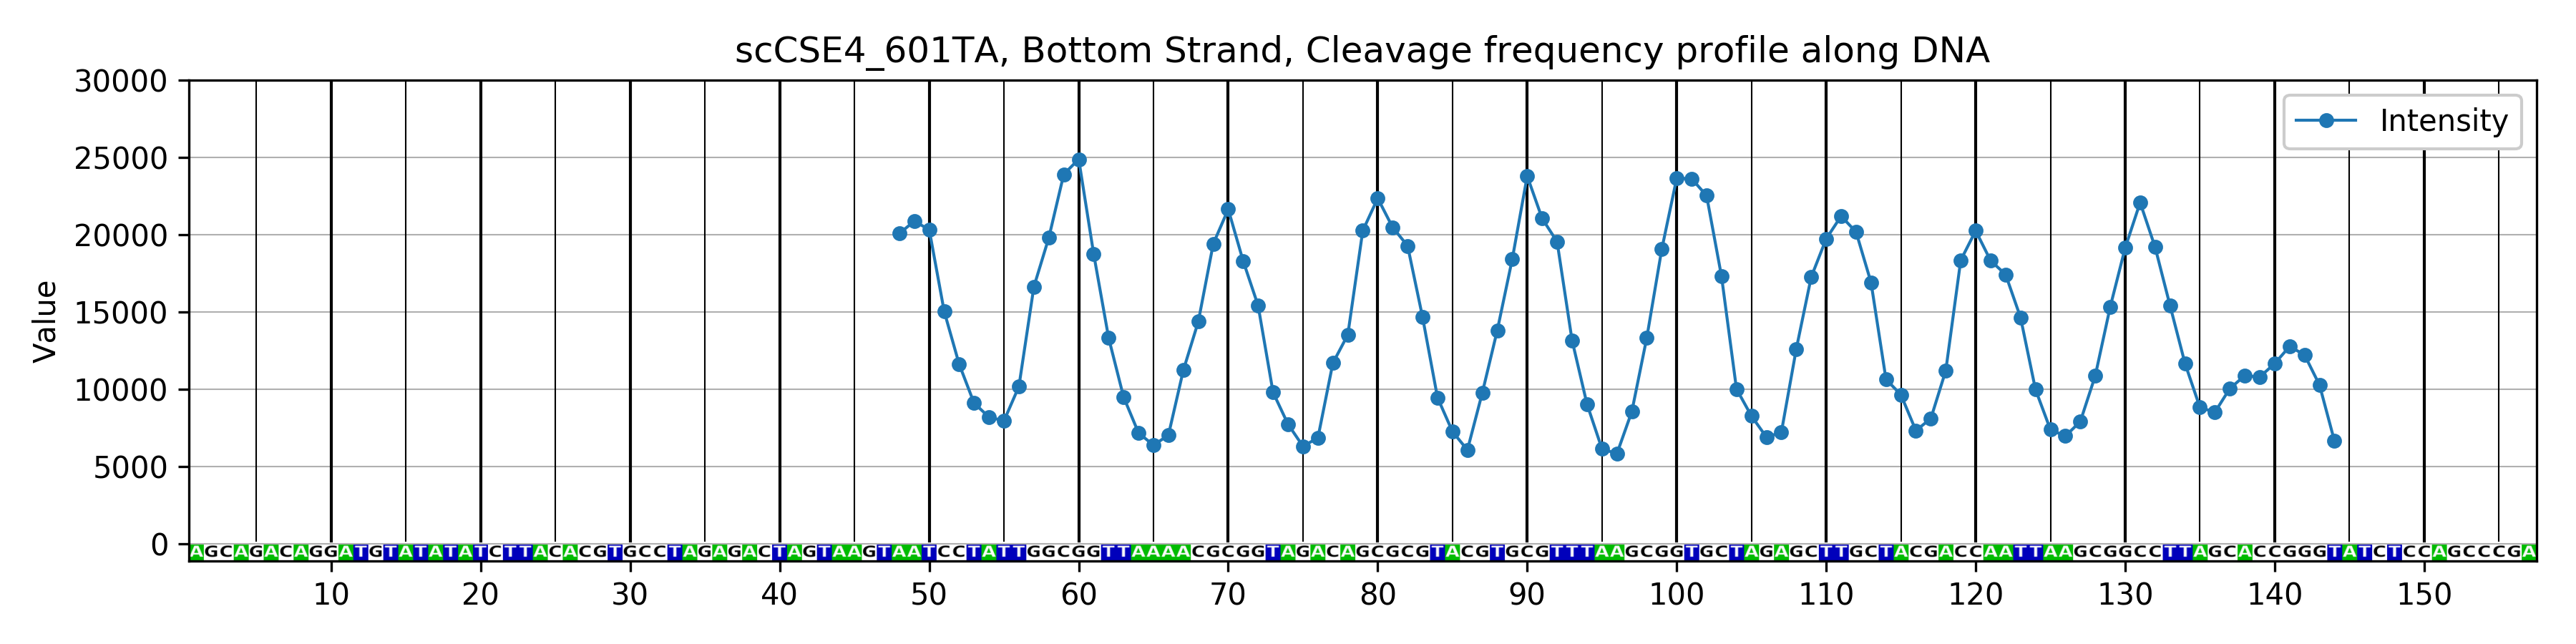
python exp_s5_plot_cl_freq.py
See the resulting plots.
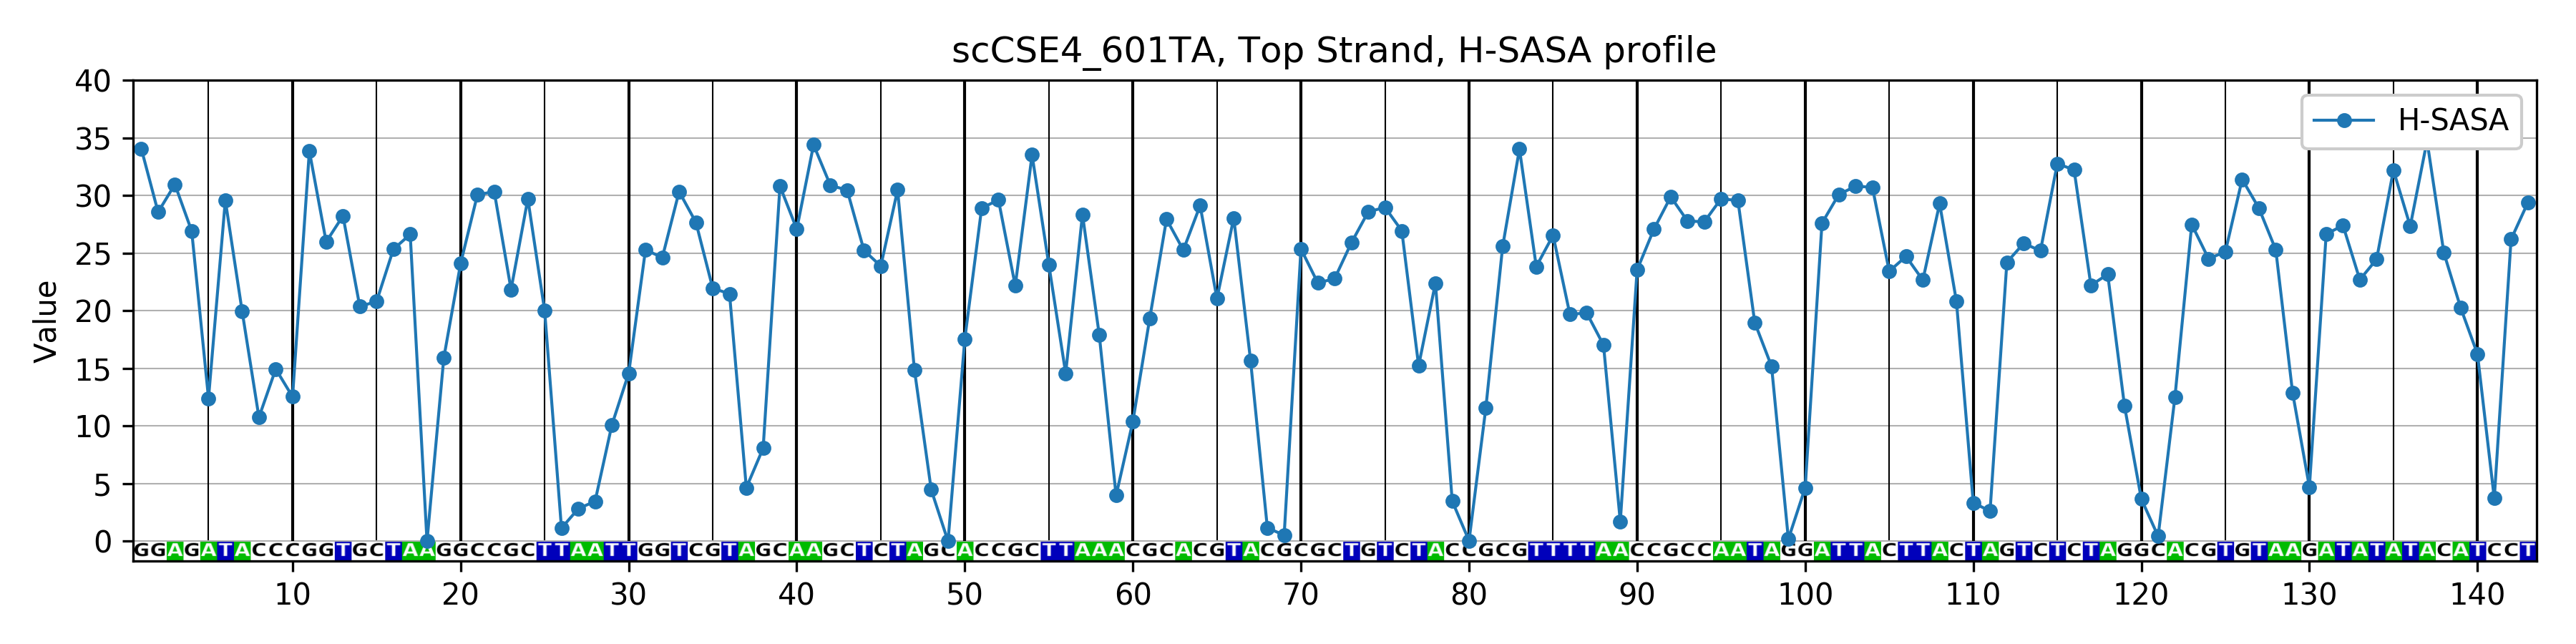
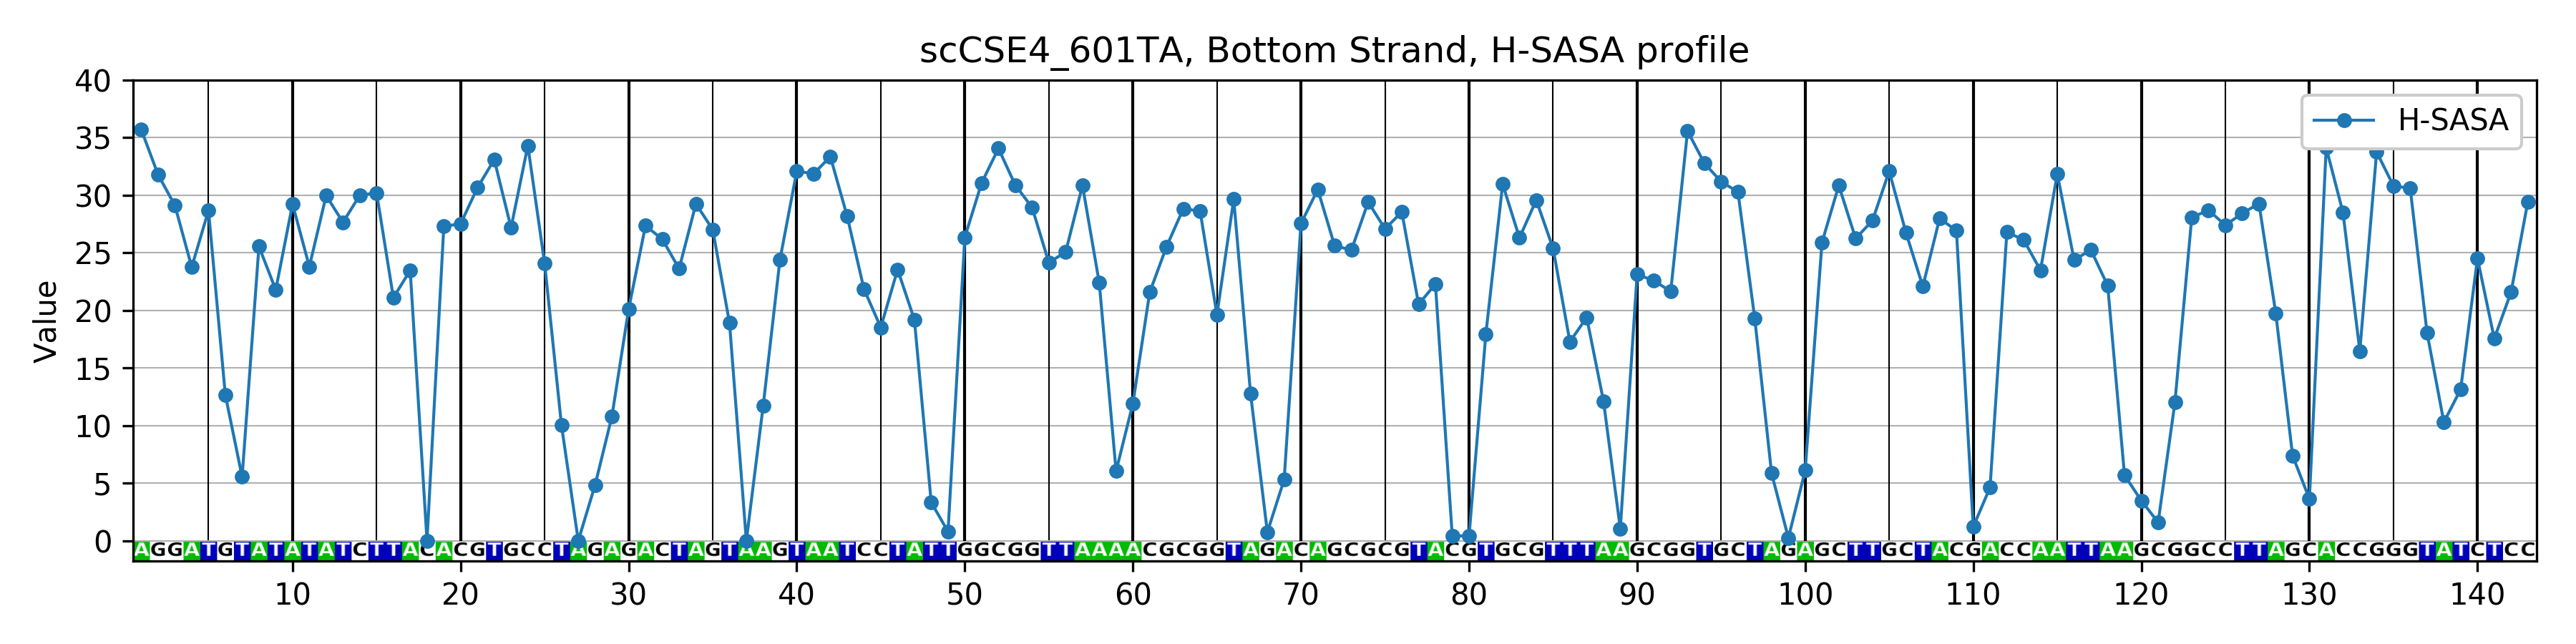
python pred_s2_calc_H-SASA.py
python pred_s3_plot_H-SASA.py
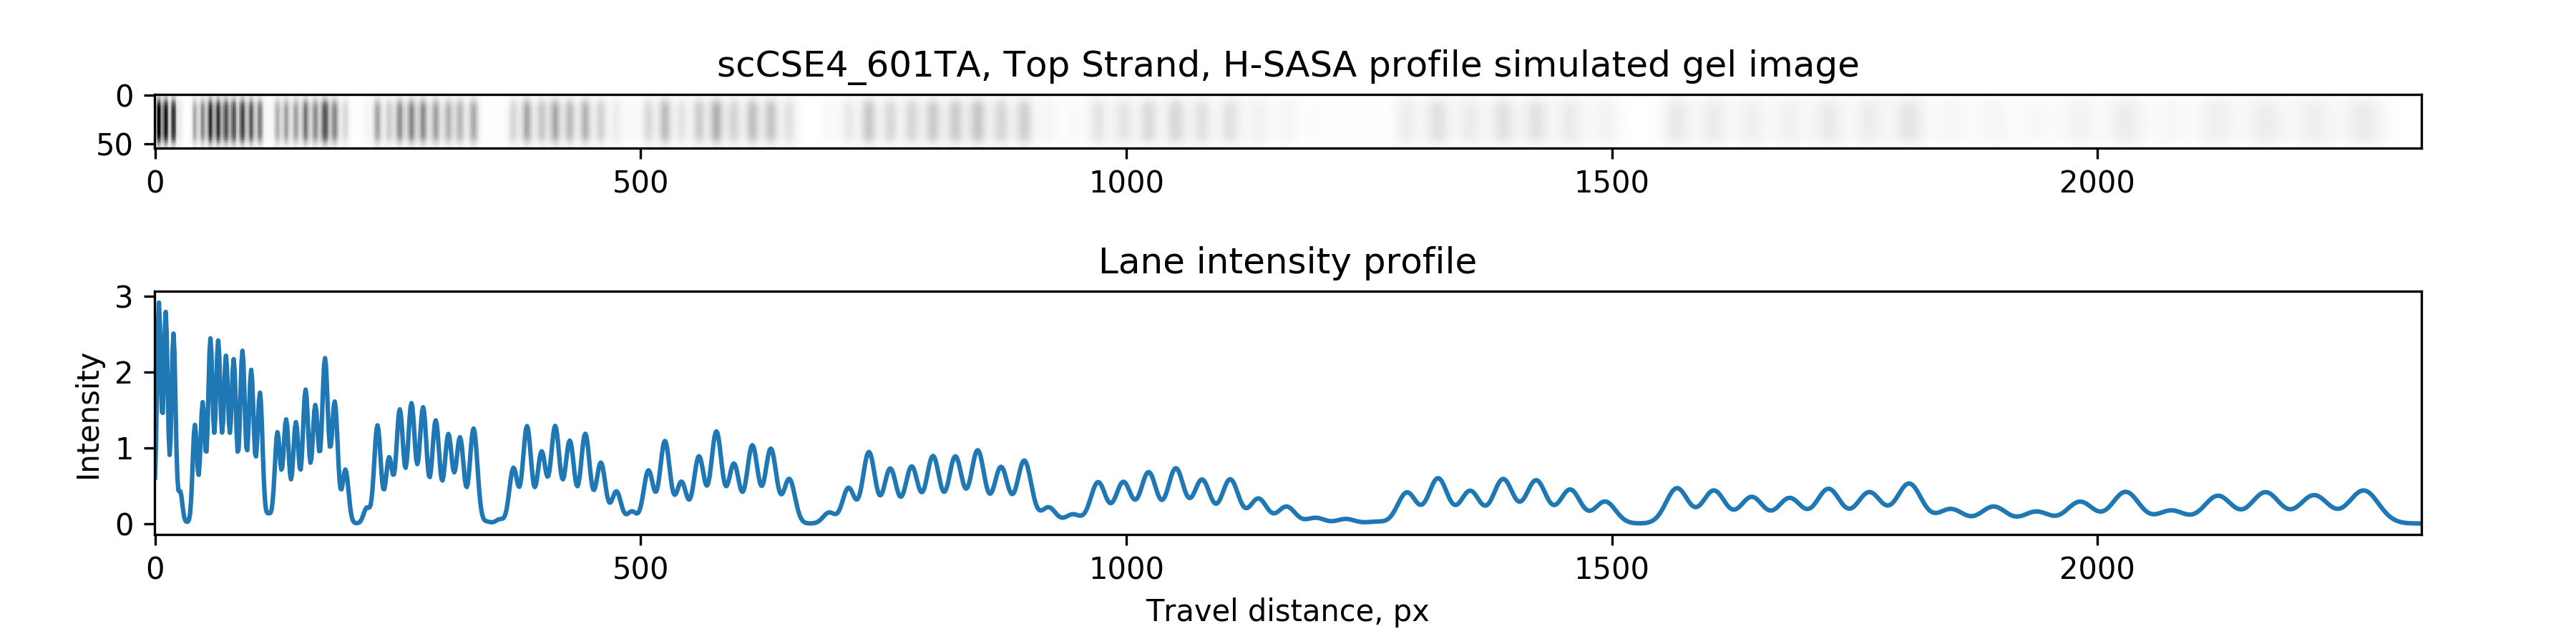
See resulting plots here and here. Also simulated gel lane profiles from theoretical profiles may be plotted.
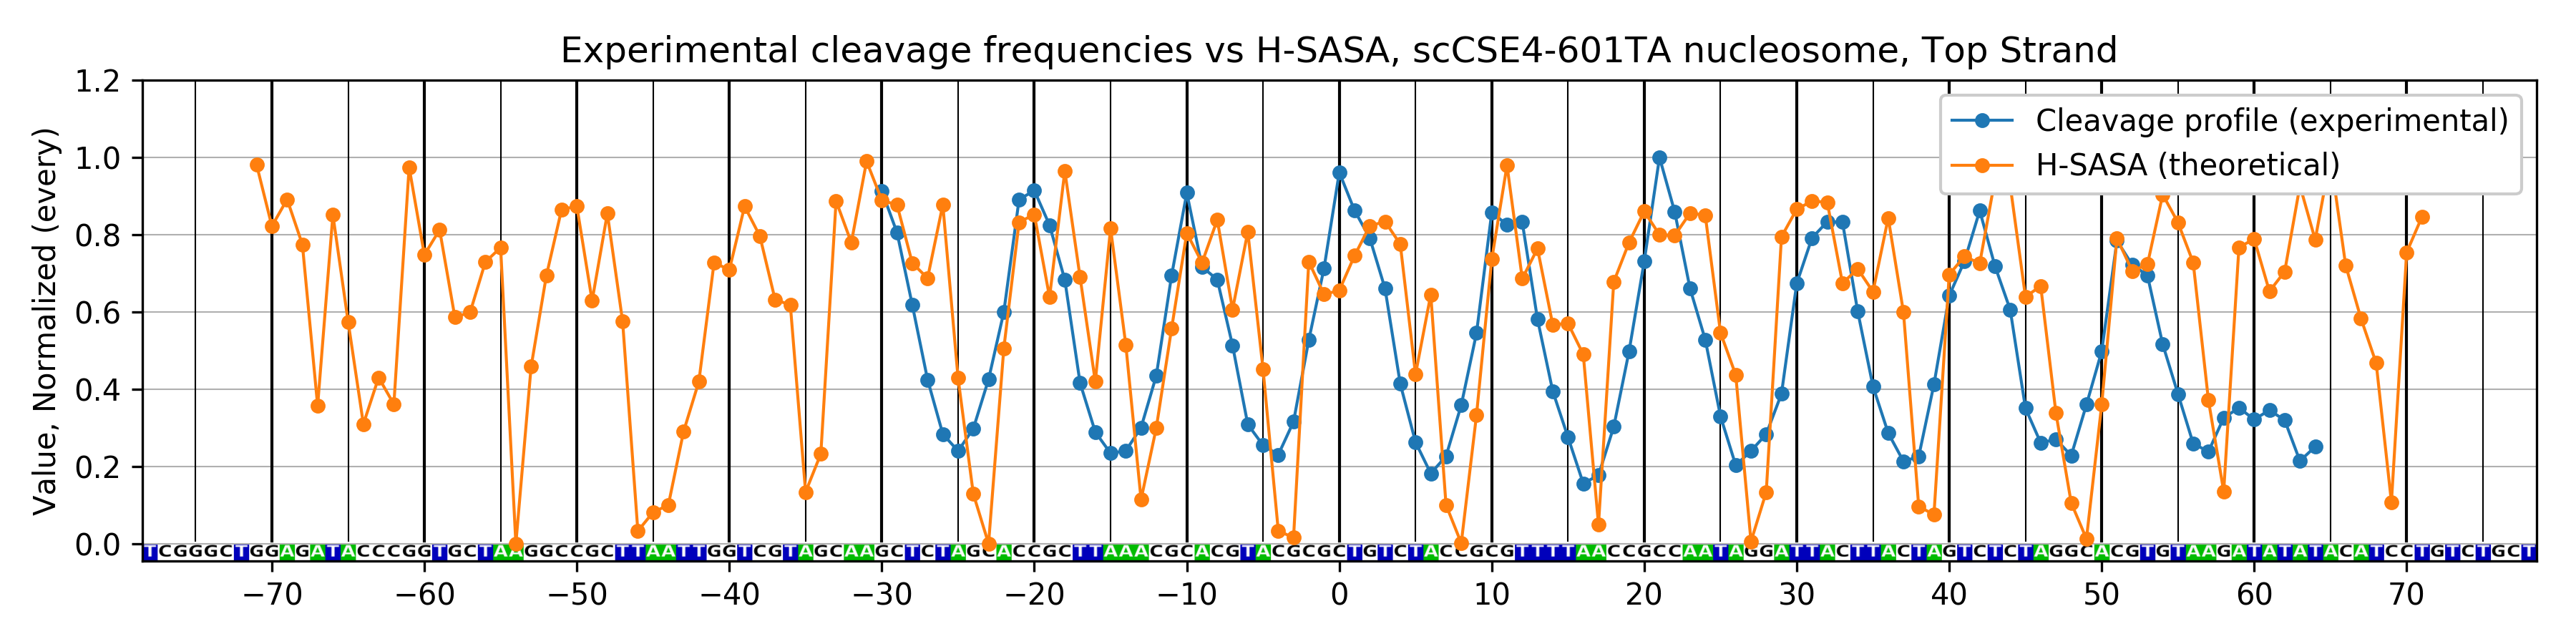
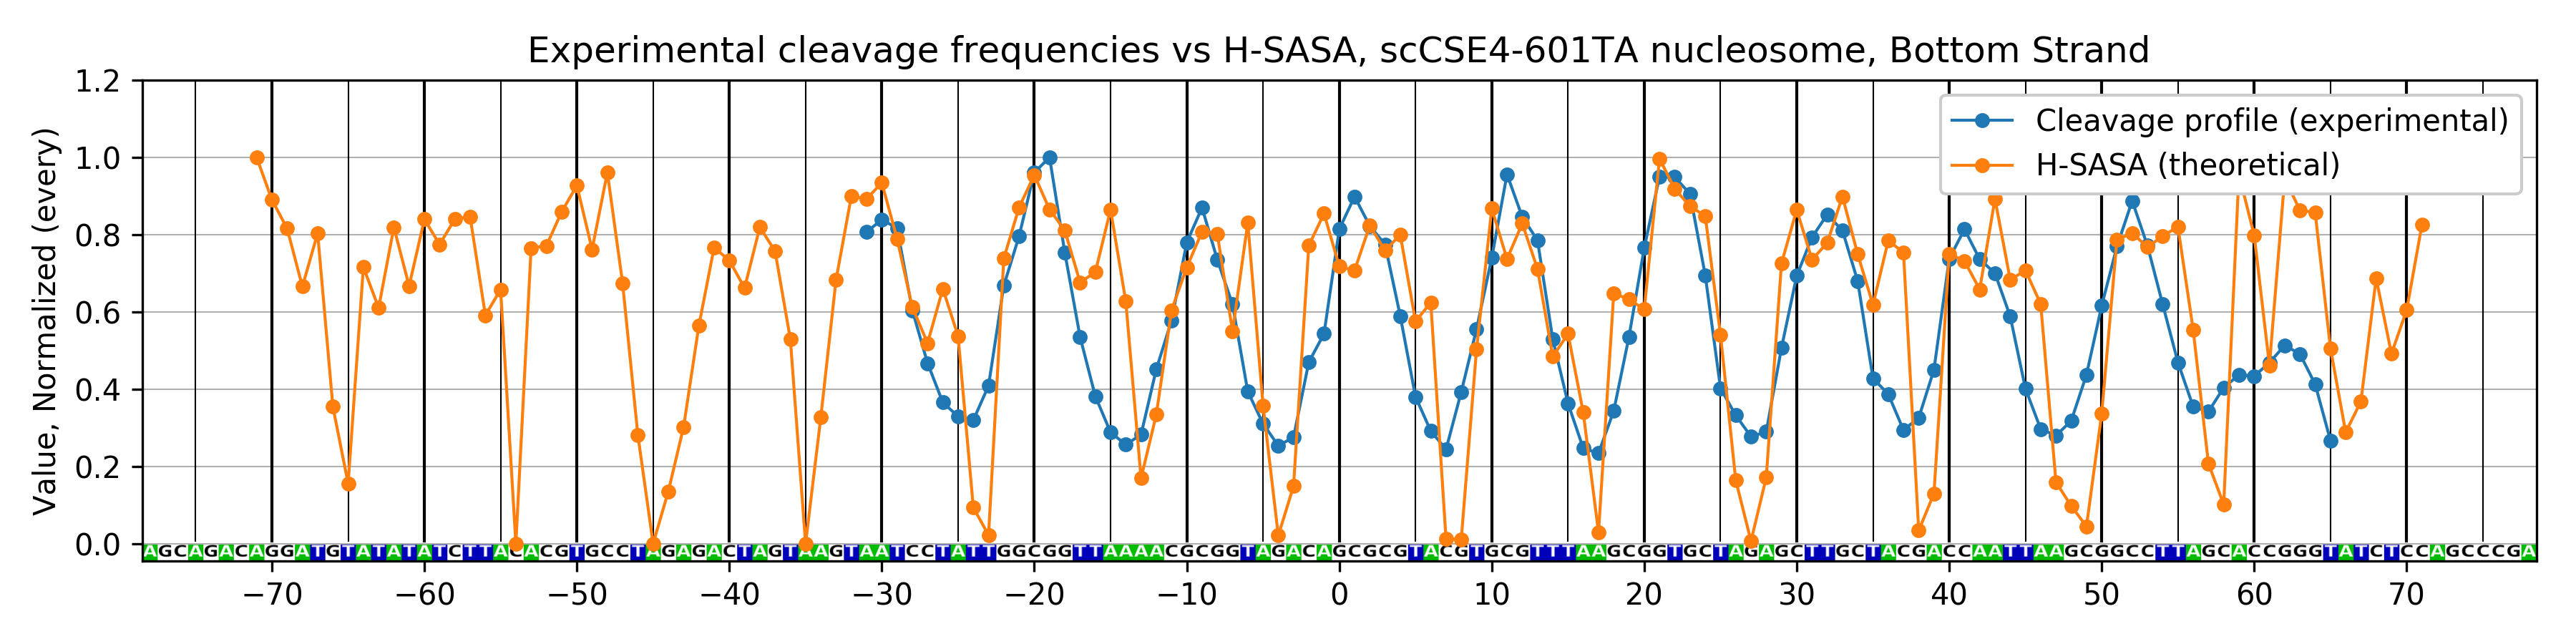
python comp_plot_exp_vs_pred.py
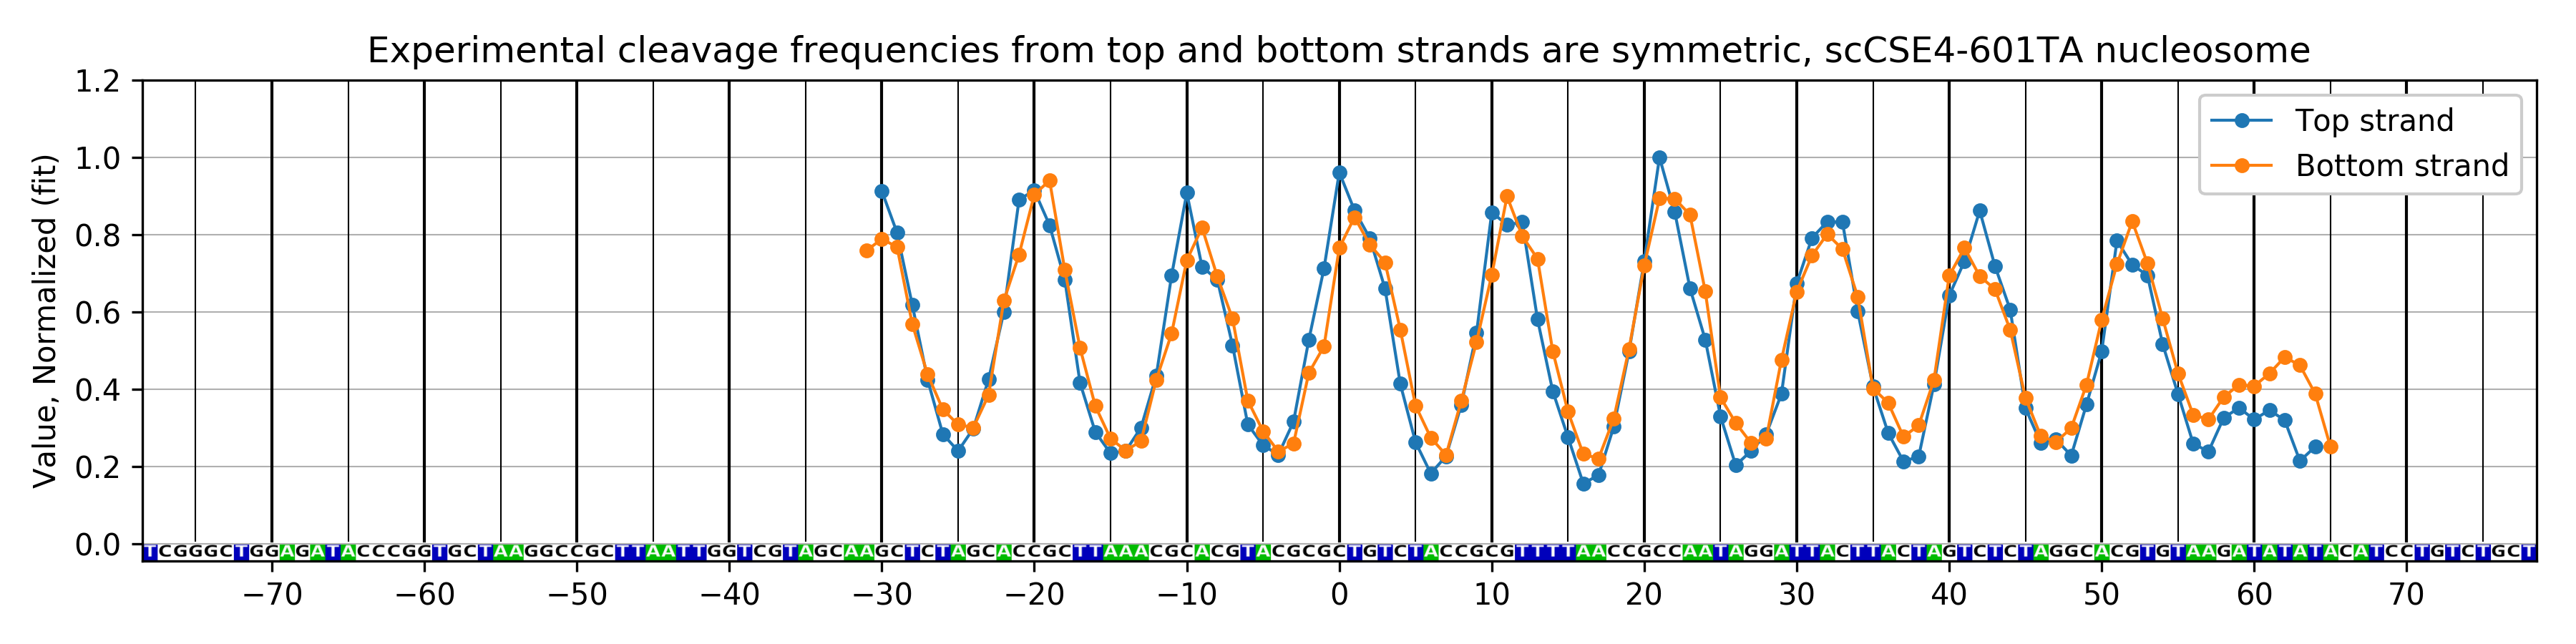
python comp_plot_exp.py
to get compartive plots between top and bottom DNA strands to assess pseudosymmetry of nucleosome with respect to the two-fold dyad symmetry axis.